 |
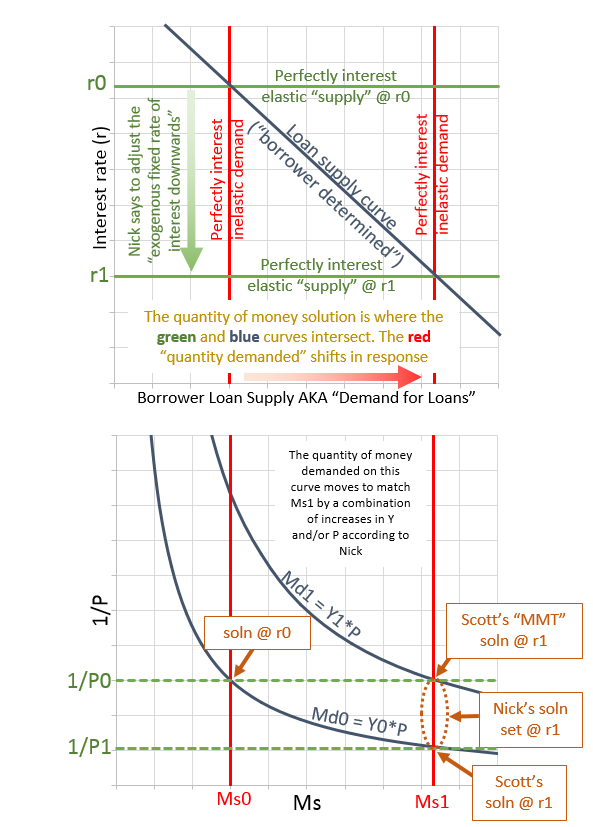
| Figure 1: Diagram of Nick Rowe's example |
In a post from Nick Rowe regarding the sense in which the stock of money is "supply-determined" he sketches out an example with the following definition for the money demand function:
Md=L(P,Y)=PY
He also mentions that:
By cutting the rate of interest, the central bank increases the quantity of loans from the central bank, which creates more money. Eventually P and/or Y will increase and the quantity of money demanded will increase in proportion to the quantity created.
Figure 1 is my attempt to sketch out what this example looks like. The items with "0" indicate the original values prior to the central bank's exogenous cut in interest rates from r0 to r1. Keep in mind that the central bank (CB) is the ONLY bank in this example: there are no commercial banks, and it only loans cash (so no deposits at all in this world) and it is compelled to lend to anyone because they are all good credit risks. I'll also assume that the bank is compelled to sell back to each individual borrower their debt on a dollar for dollar basis at the discretion of the borrower. Some of these assumptions may not be important for the logic of the post though!
Note that the blue downward sloping curve in the upper plot is the "supply curve for loans determined by borrowers" which Nick states is equivalent to "demand for loans by borrowers" in "normal language." He points this out in the comments in his previous post. Also note Md0 corresponds to Y0 and Md1 corresponds to Y1 (if P did not change from P0). However, it's possible also that Y does not change from Y0 and P instead changes from P0 to P1. In fact Nick implies that either or both P and Y could increase in this case which gives us the set of solutions for 1/P lying between the two blue money demand curves (Md0 and Md1) along the red supply curve on the right (Ms1).
Scott Sumner thinks that Nick must mean that where Md0 and Ms1 cross is the solution. He also claims that the MMT people would say that the solution is where Md1 and Ms1 cross. I think Nick is actually saying it can lie anywhere between those extremes.
Also note that in the upper plot the two horizontal green solid lines are the "perfectly-elastic supply functions" for money (each at a fixed interest rate, r0 and r1), and that the two vertical red lines in the upper chart are the two "perfectly interest inelastic" demand curves for money. Assume the red vertical line on the left is Md0 and that it has already reached equilibrium to match the supply of money (Ms0 in the lower chart). After r is lowered from r0 to r1, then Ms0 goes to Ms1 in accordance with the borrower determined supply for loans curve in the upper plot. Then *eventually* the demand curve for money in the upper plot (still perfectly interest inelastic, and thus vertical) will move right to match the supply curve (Ms1) in the lower plot.
One more thought on the upper plot (with the CB "exogenously" determined interest rate on the y-axis). The solution where the downward sloping blue curve (borrower determined supply curve for loans) intersects the horizontal green "perfectly interest-elastic 'supply' curves for money." I've already noted how in "normal language" (according to Nick) the "supply curve for loans" is called "demand for loans." However, it's better described as a supply curve. But then we have two supply curves intersecting. But then it occurred me to make the following linguistic substitutions, and I think it all becomes a lot more clear:
Replace "loans" with "bonds."
Replace "borrowers" with "bond issuers."
Then the blue line's name makes more sense as a supply curve as we've noted. But also, the horizontal "supply for money" curves instead become "perfectly interest-elastic *DEMAND* curves for bonds at exogenously fixed rates of interest." So then we're back to quantity being determined in the usual way by a supply curve intersecting a demand curve. Hurray! I comment on that here on Nick's post.
The red perfectly interest-inelastic vertical demand for money curves in the upper plot do NOT determine the quantity of money, and instead follow the solution determined by the other two curves.
Note: Scott Sumner suggested in a comment that instead of 1/P on the y-axis in the lower plot, I should instead plot 1/NGDP = 1/(P*Y). If I did this, then there would only be a single downward sloping (rectangular hyperbola) blue Md curve and the solution set of Nick Rowe at Ms1 would collapse to a single point on that curve. I.e. Scott's solution and the "MMT" solution would be indistinguishable (which would probably not please Scott!).
Note that in the upper plot, the x-axis could be labeled "Quantity of loan-principal demanded/supplied (measured in dollars)."
With this later comment, Nick Rowe essentially establishes his solution set at r1 (in Figure 1's lower plot) to be the entire red ray labelled "Ms1"... it would be the small line segment if P and Y were precluded from decreasing.
Hi Tom.
ReplyDeleteTwo comments:
1) The difference between Nick's explanation and Scott's is at least partly explained by their different nationalities!. Nick assumes that the central bank sets the interest rate. Scott assumes that the central bank determines the quantity of reserves. These assumptions reflect the different models used by their respective central banks. Fed controls the quantity of reserves with OMOs in order to target a desired Fed Funds rate (or rather, it used to - in these days of excess reserves, it controls the IOR rate, not the quantity of reserves). Bank of Canada (like the BoE) explicitly sets the interest rate on reserves and uses OMOs to maintain market rates on substitutes broadly in line with that rate.
1) I wonder how much of this is signalling? Cutting the interest rate is a signal to the private sector that more money will be made available for lending - in this model, anyway (though in a model with private banks, cutting interest rates could have the opposite effect).
Hi Frances, in response to your first point 1.) ...:D
DeleteI see your point, however I think in this case the reason has more to do with how Nick set the problem up: There's no other banks other than the CB. It could choose either to fix the interest rate and let the stock of money be endogenous, or it could exogenously fix the quantity of money (Nick explicitly states in several posts that the CB can always "force" as much money as it wants into existence through purchases... and loans are a purchase like any other... but if not through loans then through buying other assets), and let the rate of interest vary endogenously.
Responding to your second 1)
I'm not sure. All I'm going off is his statement that lower interest rates results in more lending. Thus I drew a downward sloping curve. Interesting about private banks... I didn't even think of that.
Thanks for stopping by to comment! It seems Scott has put up a new post today with a subject partly inspired by your comments (amongst others) yesterday. :D
This comment has been removed by the author.
DeleteSure, there are two alternative approaches. But Nick does seem to be arguing that the interest rate is exogenously fixed, which is closer to RBC's approach than the Fed's.
DeleteHah - yes, I've seen Scott's post (and commented!).